Creating a Risk Matrix with Jira and Confluence
Creating a Risk Matrix with Jira and Confluence turned out to be an easy enough task that provided a much liked feature to the users.
What is a Risk Matrix ?
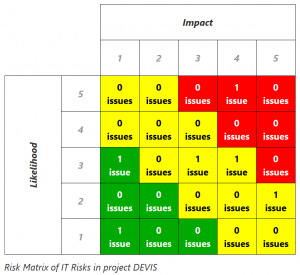
 A risk matrix is a table showing the distribution of risks based on their impact and likelihood (probability).
Such a table is organized in rows representing the likelihood, and columns representing the impact (or vice versa). Each cell represents a combination of both and is colored green, yellow or red depending on the severity of its combination. A risk with a heavy impact and a high likelihood is red, low and low leads to green, the in-betweens are yellow.
In order to get the typical coloring pattern as shown on the left, either the rows or columns need to be ordered ascending while the other needs to be ordered descending.
What can Jira and Confluence do ?
Jira is often used to track project tasks, and especially project risks. A risk matrix is a very common reporting method on the overall risk assessment of a project. As long as the impact and the likelihood is tracked in each Risk issue in Jira you can use a Confluence page to show a corresponding risk matrix automatically. Even better, if you are using a self hosted Data Center environment of Confluence, you can create a user macro that allows its usage on any page offering custom options via a macro dialog.
How to implement such a Risk Matrix ?
If you have a Confluence instance linked to your Jira you can build a risk matrix manually, using a basic table and Jira macros in each cell. That is a bit cumbersome and also does not allow too much of making it look nice.
If you host Confluence yourself, you can implement a user macro that allows a more convenient input of parameters via a dialog and also for coloring the table nicely.
If you are interested in creating a risk matrix with Jira and Confluence, feel free to read my documentation about it here or click the button below:
Read more…


